Trouble Shooting
Node startup failure.
Linux: illegal instruction?
如果在使用官方提供的二进制文件启动节点时遇到 'illegal instruction' 错误,这表明您的CPU指令集与编译二进制文件时使用的指令集不匹配。 您可以尝试从发布页面下载兼容版本或自行编译。
Linux: GLIBC_2.27 not found?
Conflux二进制文件依赖于 glibc 库。 如果系统未安装该库,或者安装的版本过低,您可能会遇到此错误。
kvdb_rocksdb - DB has been previously marked as corrupted, attempting repair
这个错误发生是因为节点的数据文件已损坏,无法启动。 在这种情况下,您可以尝试删除数据目录,让节点重新同步数据。
如果您想快速启动节点,可以直接下载节点数据快照,解压并启动节点。
Err value: PKCS#8 cryptographic error
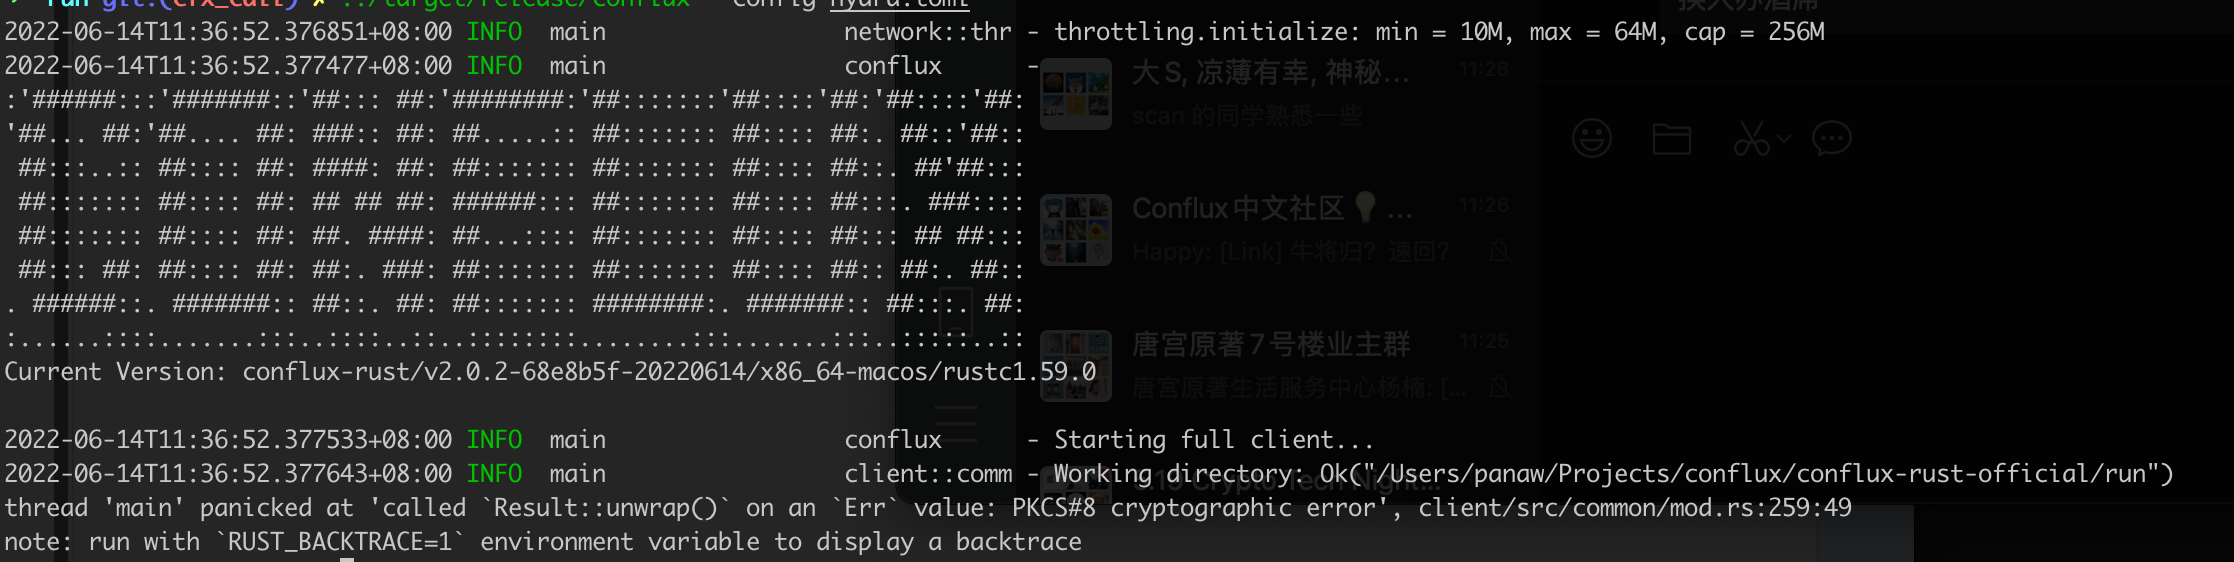
这个错误可能是由于为pos_key输入的密码不正确。
No such device or address
failed to start full client: Os { code: 6, kind: Uncategorized, message: "No such device or address" }
使用Docker启动节点时可能出现这个错误。 节点尝试从标准输入读取 pos_key 密码,如果无法读取,则返回错误。 在这种情况下,您可以在配置文件中配置密码,或将其设置为环境变量。
Mac System Symbol not found
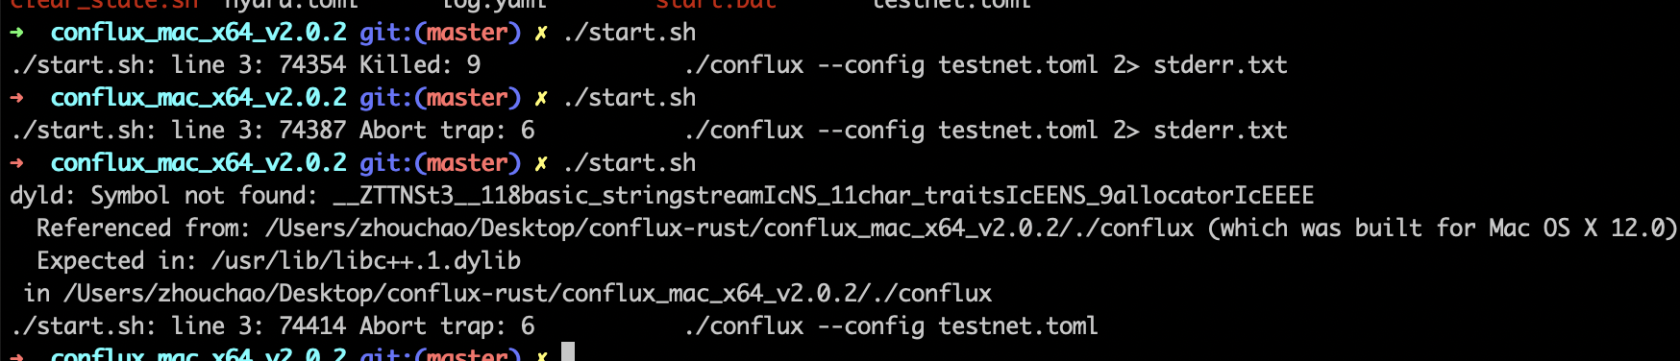
如果出现这种情况,表明宿主系统的版本过低。 目前,只支持macOS 12或以上的系统。
此外,在Mac上运行节点程序时,重要的是根据您电脑的架构选择正确的处理器版本。 M1和x86版本不可互换。
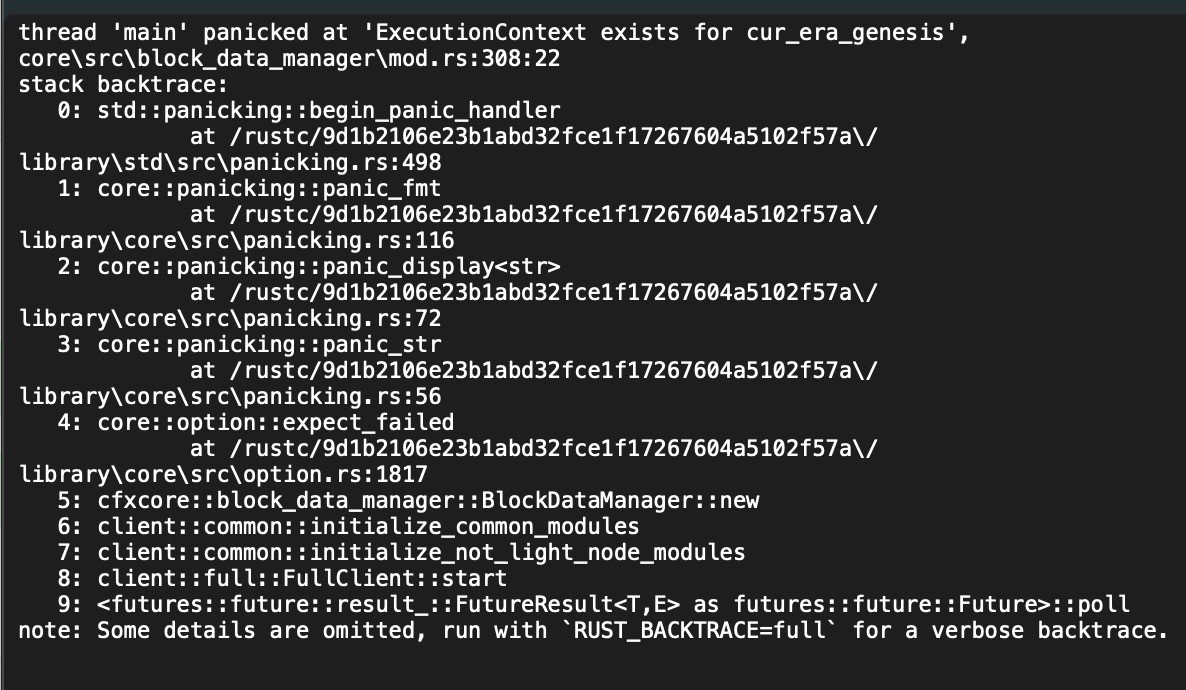
Windows System ExecutionContext exists for cur_era_genesis core\src\block_data_manager\mod.rs
在Windows系统上使用数据快照启动节点时,您可能会遇到以下错误:
节点在启动后不久崩溃。
如果这个问题发生在Linux系统上,可能是由于启动账户权限不足。 您可以尝试以sudo模式启动。
节点数据同步问题及其解决方法:
节点启动后无法连接到其他节点
可能是由于使用了错误的配置文件,例如使用主网二进制文件与测试网配置,测试网二进制文件与主网配置,或者在启动节点时未指定配置文件。
通常不连接到其他节点的根本原因是没有正确指定启动节��点。
另一种可能性是由于网络问题导致节点无法连接到网络。
如何确定节点是否正常运行?
- 检查运行日志中的latest epoch:
如果节点的运行日志中的latest epoch不断增加,或者通过cfx_getStatus方法获得的epochNumber持续上升,说明节点正在正常运行。
Catch-up mode: false, latest epoch: 85959xxxx
- Check StatisticsInner in the running logs:
If the latest epoch in the node's running logs is not increasing, but the numbers in SyncGraphStatistics and ConsensusGraphStatistics within StatisticsInner keep growing, the node is still running normally.
Statistics: StatisticsInner {
    sync_graph: SyncGraphStatistics {
        inserted_block_count: 1195746,
        inserted_header_count: 1324647
    },
    consensus_graph: ConsensusGraphStatistics {
        inserted_block_count: 154808,
        activated_block_count: 1305980,
        processed_block_count: 1305982
    }
}
- Check construct_pivot_state in the running logs:
If the index or height keep increase, the node is running normally.
cfxcore::con - construct_pivot_state: index 30774 height 86370774 compute_epoch true
如何确定节点是否同步到最新的区块?
如果节点的运行日志显示Catch-up mode: false,表示节点已经同步到最新数据。
为什么我的节点没有在同步?
节点同步可能遇到各种问题,常见的包括:
- 节点机器上的磁盘空间不足。
- 网络问题,如进出带宽不足(推荐至少5M)。
- Linux最大文件打开限制设置不够高(ulimit -n 10000)。
- 配置文件指定不正确;没有正确的配置文件设置,无法定位启动节点,导致数据同步问题。 (当通过 Docker 和 挂载目录 启动时,很容易忘记指定配置文件。)
- 检查节点的运行日志是否有任何错误。 (通过 start.sh 启动时,错误信息存储在 stderr.txt 中。)
如果检查了上述所有问题都不存在,但节点的 latest epoch 没有增加,那么节点可能正常运行但正在执行其他任务,如创建检查点。 在这种情况下,建议观察一段时间,因为这种情况可能持续数小时甚至数十小时。
重启节点后,纪元高度保持不变?
重启节点后,可能会 era 检查点进行状态重建操作。 这个过程需要较长时间,从半小时到几小时不等。 请耐心等待。
重启后同步为何需要较长时间�?
重启节点后,它会从上一个检查点同步数据并重放区块数据。 所需时间根据距离上一个检查点的距离而异。 之后,它将开始从最新区块同步。
这是正常现象,通常会花费几分钟到十多分钟的时间。
为什么区块高度停止增长?
如果区块高度停止增长,您可以检查日志或终端以确定是否有任何错误。 如果没有错误,最有可能是由于网络原因,您可以尝试重启节点。
如何检查错误日志?
如果您通过 start.sh 运行节点,您可以在同一目录下的 stderr.txt 中检查错误日志。
在测试网上从头开始同步数据,同步过程中卡住
要在测试网上进行完整同步,需要将选项 additional_maintained_snapshot_count 增加到50。
failed to calculate mempool broadcast RTT: SystemTimeError(1.2762543s)
details = '''panicked at 'failed to calculate mempool broadcast RTT: SystemTimeError(1.2762543s)', core\src\pos\mempool\shared_mempool\peer_manager.rs:400:18'''
backtrace = '''
   0:     0x7ff737fa5645 - backtrace::backtrace::trace::hab5abe5046f447b5
   1:     0x7ff737fa4aac - backtrace::capture::Backtrace::new::hd9f1f4afb992e4d5
   2:     0x7ff73781b172 - crash_handler::setup_panic_handler::he3eed2ba07c7a235
   3:     0x7ff7380d6cf6 - std::panicking::rust_panic_with_hook
                               at /rustc/9d1b2106e23b1abd32fce1f17267604a5102f57a\/library\std\src\panicking.rs:610
   4:     0x7ff7380d6afb - std::panicking::begin_panic_handler::closure$0
                               at /rustc/9d1b2106e23b1abd32fce1f17267604a5102f57a\/library\std\src\panicking.rs:502
   5:     0x7ff7380d4377 - std::sys_common::backtrace::__rust_end_short_backtrace<std::panicking::begin_panic_handler::closure$0,never$>
                               at /rustc/9d1b2106e23b1abd32fce1f17267604a5102f57a\/library\std\src\sys_common\backtrace.rs:139
   6:     0x7ff7380d67f9 - std::panicking::begin_panic_handler
                               at /rustc/9d1b2106e23b1abd32fce1f17267604a5102f57a\/library\std\src\panicking.rs:498
   7:     0x7ff7384c8e10 - core::panicking::panic_fmt
                               at /rustc/9d1b2106e23b1abd32fce1f17267604a5102f57a\/library\core\src\panicking.rs:116
   8:     0x7ff7384c8f23 - core::result::unwrap_failed
                               at /rustc/9d1b2106e23b1abd32fce1f17267604a5102f57a\/library\core\src\result.rs:1690
   9:     0x7ff7374fcb6f - cfxcore::pos::mempool::shared_mempool::peer_manager::PeerManager::process_broadcast_ack::h66a5c6263f1cb4c5
  10:     0x7ff7374f5e19 - cfxcore::pos::mempool::shared_mempool::coordinator::coordinator::{{closure}}::h6c1ff8196b71855b
  11:     0x7ff737543216 - std::panicking::try::hd909c3032f511b0c
  12:     0x7ff73776aca6 - tokio::runtime::task::harness::Harness<T,S>::complete::hf2bbf17ca3ded03d
  13:     0x7ff73775b7ee - tokio::runtime::task::harness::Harness<T,S>::poll::h0348d72954fb7fe3
  14:     0x7ff7379a174f - std::thread::local::LocalKey<T>::with::h1b1b4832535dd8eb
  15:     0x7ff7379a0508 - tokio::runtime::thread_pool::worker::Context::run::h1871366c06b8b19b
  16:     0x7ff73799f313 - tokio::runtime::thread_pool::worker::Context::run::h1871366c06b8b19b
  17:     0x7ff737997b08 - tokio::macros::scoped_tls::ScopedKey<T>::set::h72c7679a82ac49e7
  18:     0x7ff73799ee3a - tokio::runtime::thread_pool::worker::run::he96293bdc96c9c85
  19:     0x7ff7379a25d5 - tokio::runtime::task::core::CoreStage<T>::poll::hfebd390d78b509ef
  20:     0x7ff7379a6036 - std::panicking::try::h2cdfe9794da6da4e
  21:     0x7ff7379a4150 - tokio::runtime::task::harness::Harness<T,S>::poll::h32aca2917e8ece97
  22:     0x7ff737994efc - tokio::runtime::blocking::pool::Inner::run::h50dc8a99eae64ddb
  23:     0x7ff737990855 - std::sys_common::backtrace::__rust_begin_short_backtrace::hd7f858c23b97e5cf
  24:     0x7ff7379a1203 - <&T as core::fmt::Debug>::fmt::hd9ffef8910ae9eb8
  25:     0x7ff7380dd69c - alloc::boxed::impl$44::call_once
                               at /rustc/9d1b2106e23b1abd32fce1f17267604a5102f57a\library\alloc\src\boxed.rs:1854
  26:     0x7ff7380dd69c - alloc::boxed::impl$44::call_once
                               at /rustc/9d1b2106e23b1abd32fce1f17267604a5102f57a\library\alloc\src\boxed.rs:1854
  27:     0x7ff7380dd69c - std::sys::windows::thread::impl$0::new::thread_start
                               at /rustc/9d1b2106e23b1abd32fce1f17267604a5102f57a\/library\std\src\sys\windows\thread.rs:58
  28:     0x7ffc35637034 - BaseThreadInitThunk
  29:     0x7ffc36822651 - RtlUserThreadStart
This error is caused by the system API returning a system time that is set backward. 建议及时同步时间,以避免系统时间偏差的扩大。
正常节点运行日志
在节点运行期间,出现以下信息,这些信息不影响节点的正常功能,可以忽略。
ERROR IO Worker #2 cfxcore::con - Fail to recover state_valid

INFO COW copy failed, check file system support
INFO Background Snapshot cfx_storage: - COW copy failed, check file system support. Command "cp" "-R" "--reflink=always"
这些消息是提示,表明机器的文件系统不支持写时复制(COW)功能。 这不会影响节点的操作。 如果机器支持COW,可以帮助提高节点性能。
WARN Socket IO Worker #2 cfxcore::tra - an unexecuted tx is garbage-collected.
过多的交易在交易池中会导致池中的交易被回收。 这不会影响节点的正常运行。